
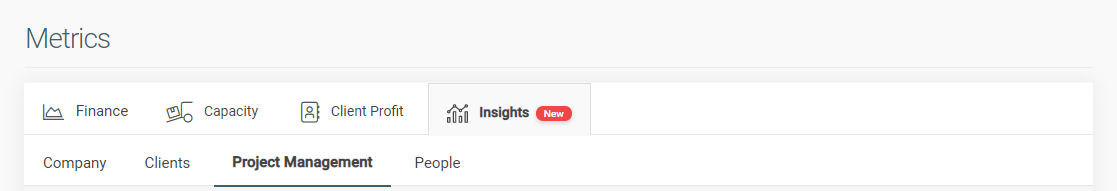
The Insights section is an optional panel within Metrics, which allows us to access to detailed information of our agency and generate specific reports according to our needs.
It is divided into 4 sections:
Company 
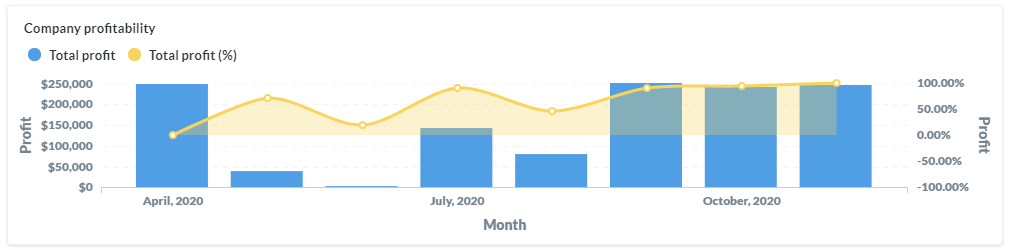
In this section we will find the general metrics of the company, which we will be able to filter by date according to the days of the income or costs that the projects had.
- Company Profitability: Only takes into account active projects and budgets (not eliminated). The chronological order is made based on the date of the income and the date of the cost or time.
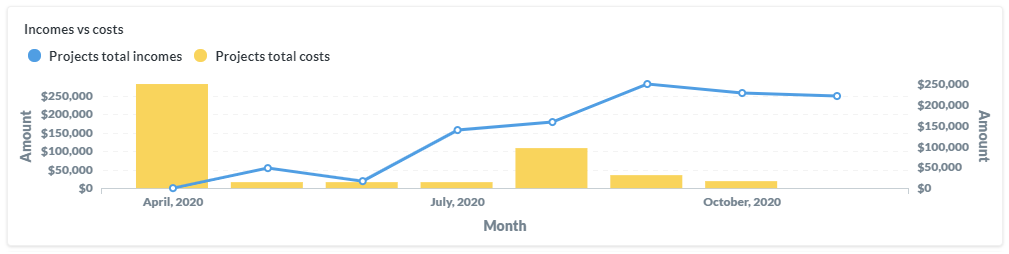
- Incomes vs Costs: Uses the same logic as the previous graph, but showing only incomes and costs according to the date of the income and the hourly cost.
- Company deviation: Displays agency deviations, based only on estimated task times and hours computed to tasks.

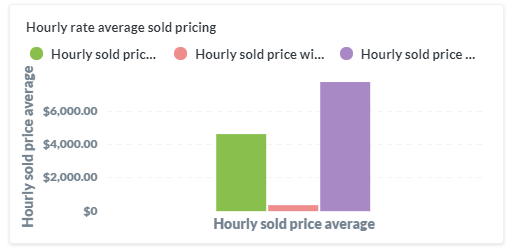
- Hourly rate average sold price: Shows an average hour sold calculated based on the fees and projects budget, over the estimated hours of the fees and estimated hours of the projects without fees. Date filters do not apply in this case.
Clients
Here we will find the metrics related to our customers, which we can filter by date and/or customer name. In the case of the date filter, if the panel shows data related to hours, the filter will be applied based on the logging time of those hours. If the panel shows data related to budgets and costs, the filter will apply to the date of entry or cost of the project.
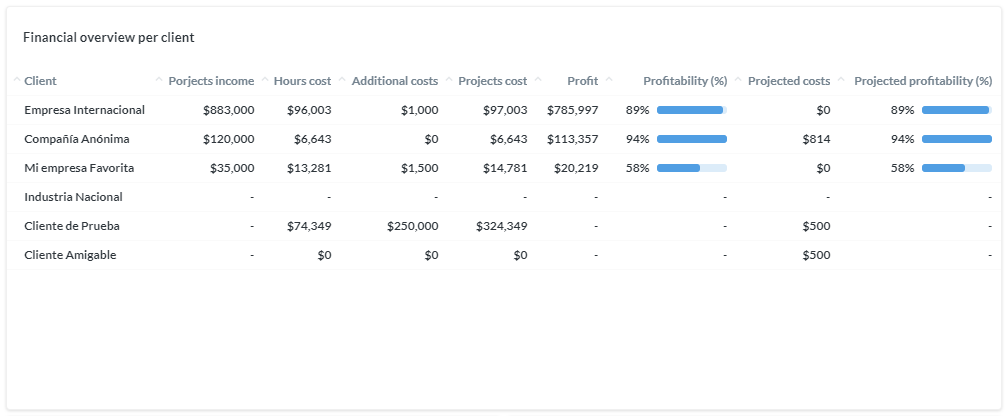
- Financial overview per client: profitability per client shown in table format. By clicking on the table headers you can sort in ascending and descending order.
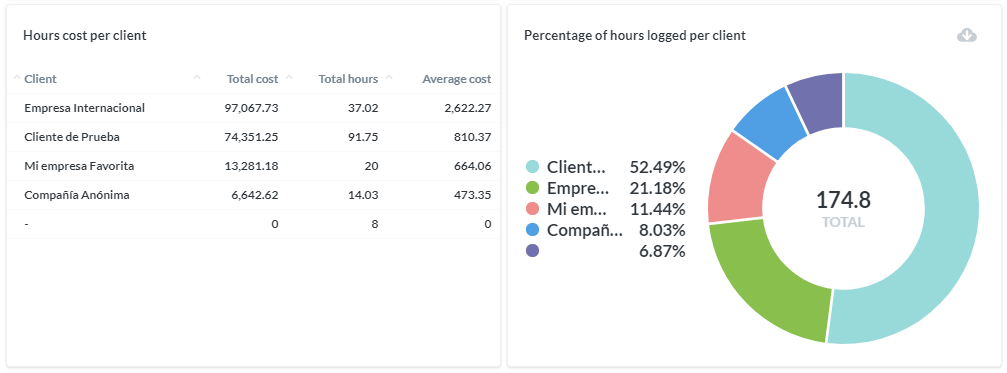
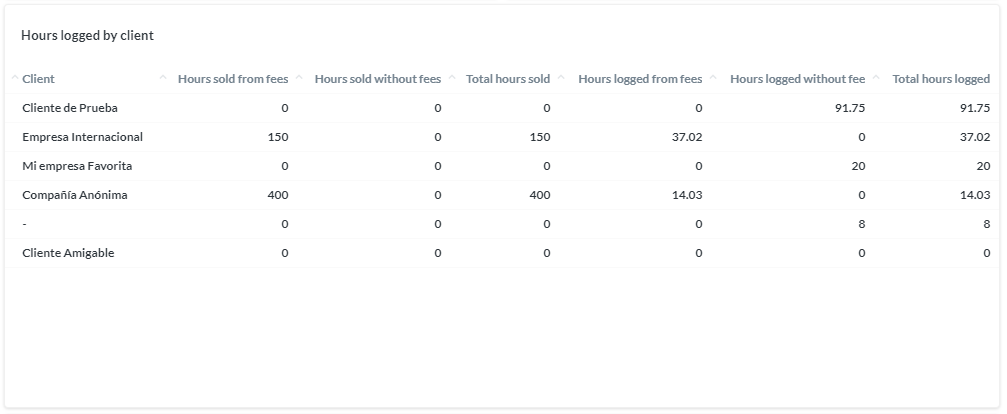
- Hours logged by client, Average hours cost per client, Hours cost per client, Percentage of hours logged per client: They show basically all the same data, ordered in different ways. The hours logged in eliminated tasks are contemplated since it is the same logic that is applied in metrics. The filters by date work on the basis of the days when time was logged.
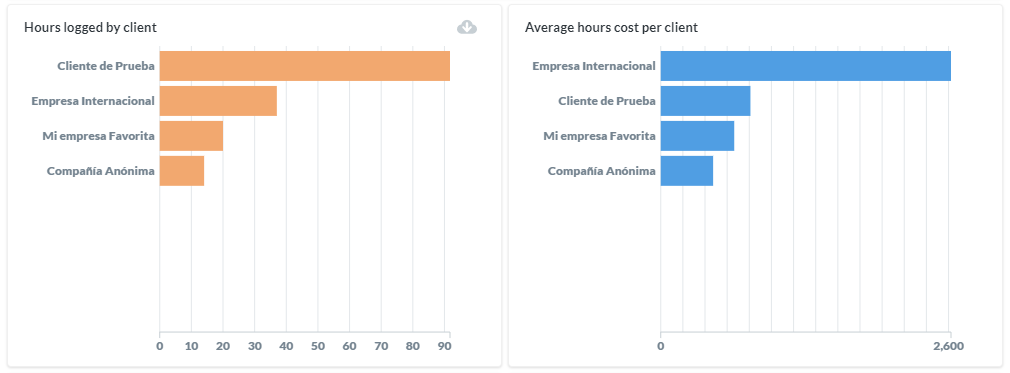
- Hours logged by client: Shows a comparison between hours sold per client and hours logged per client. Filters by date apply to fees and their recurrences, projects and their recurrences, and to the dates on which hours were computed.
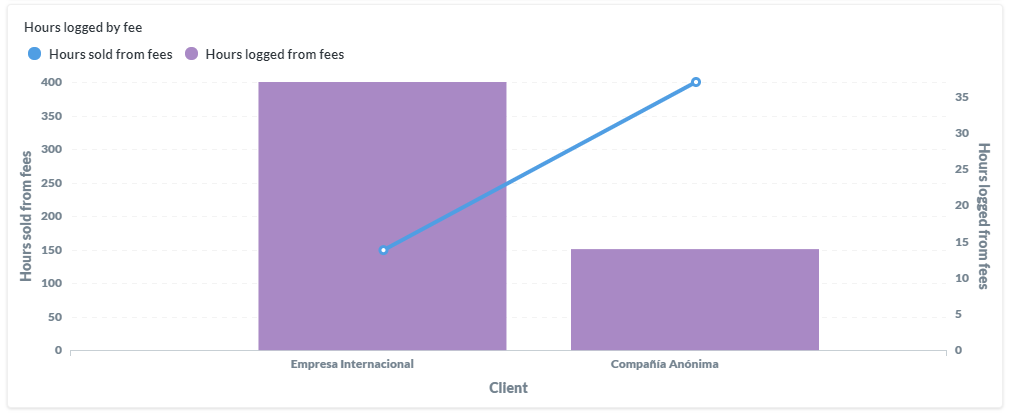
- Hours logged by fee: It compares the hours logged on the tasks of projects that have an associated fee and the hours sold (estimated) within those fees.
- Invested hours per client per user: This is the sum of the hours computed month by month for each user. By filtering by client, we can specifically see how much of the client's hours were spent.

Project Management
The metrics of this panel are focused on tasks, reworks and deliverables with different openings. It can be filtered by client name and by date, according to the beginning of the task.
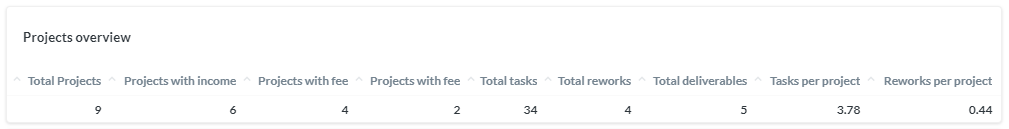
- Projects Overview: Shows an overall total of projects, tasks, reworks and deliverables.
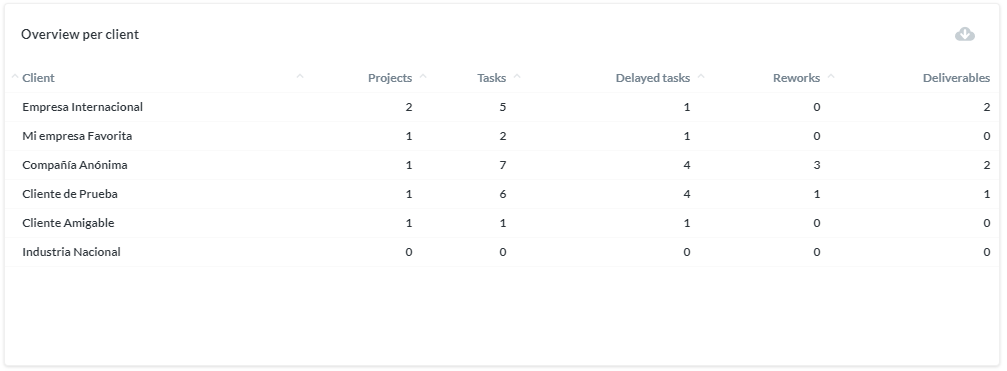
- Overview per client: It is the same information as above but open by client.
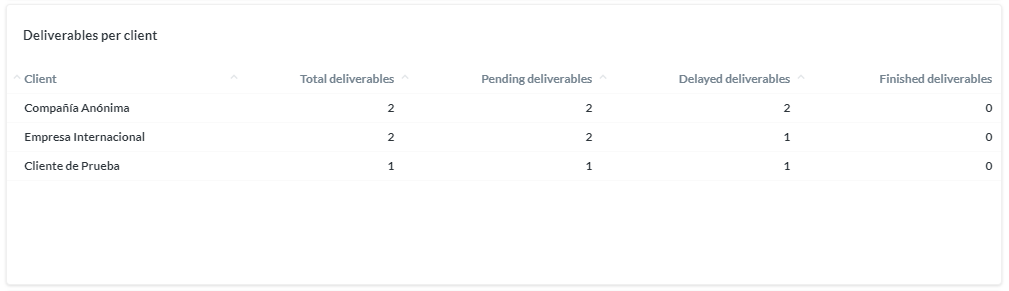
- Deliverables per client: It refers to the number of deliverables per client. The delayed deliverables column refers to the tasks marked as deliverables with a deadline prior to the current date.
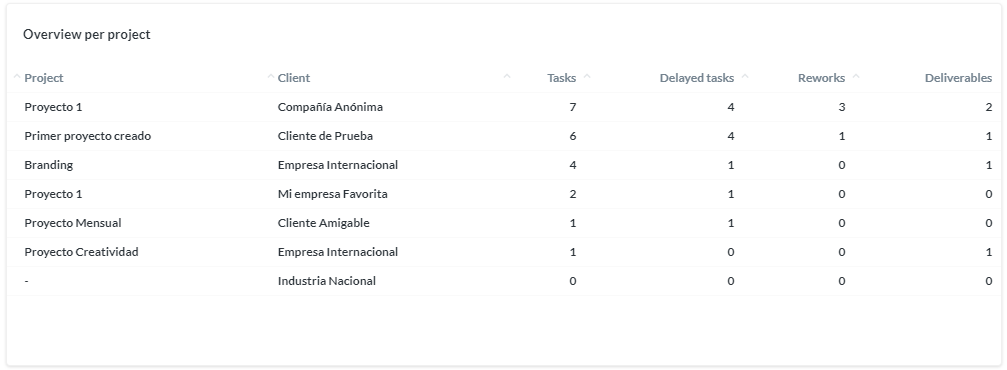
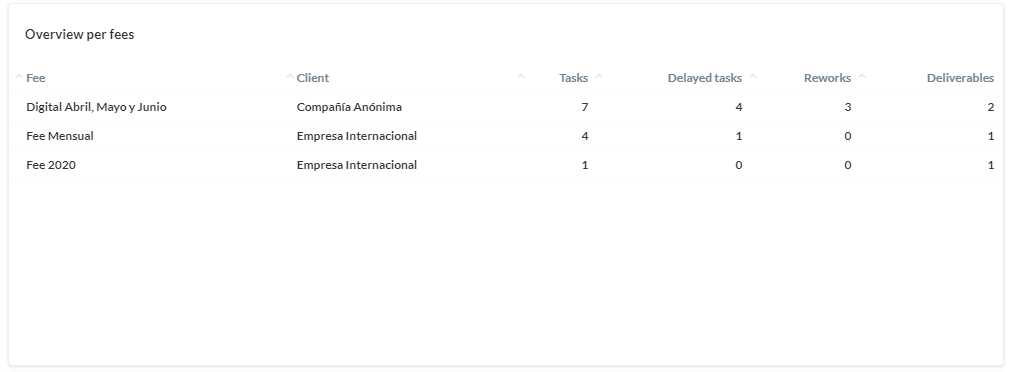
- Overview per projects, Overview per fees: It shows the same information as overview per client but with the opening by projects and fees.
- Estimated hours per task vs. logged hours per task: Shows the sum of the estimated hours of the tasks according to the client, its average and the hours computed in those tasks, also with a column with that average.

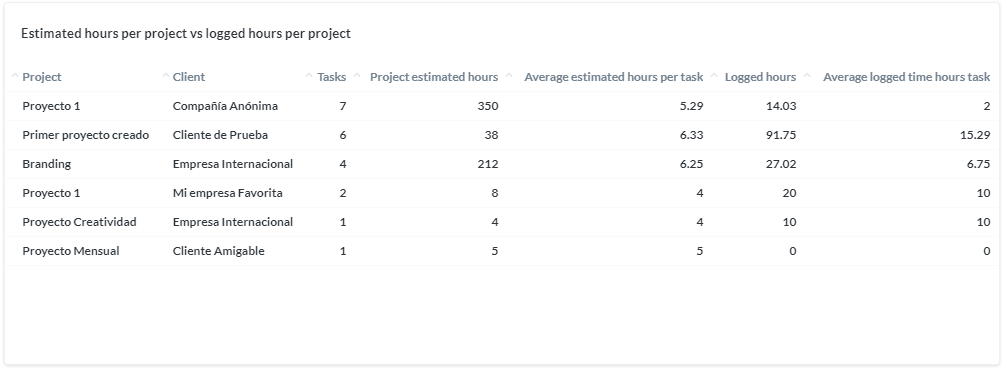
- Estimated hours per project vs logged hours per project: Similar to the previous panel, but segmented by project.
People

User-focused metrics such as salaries per user, hours sold per team, hours logged per team, etc. It is filtered based on the date of creation of the users (for user data), and by creation of the hours when referred to hours. It can also be filtered by teams and user names.
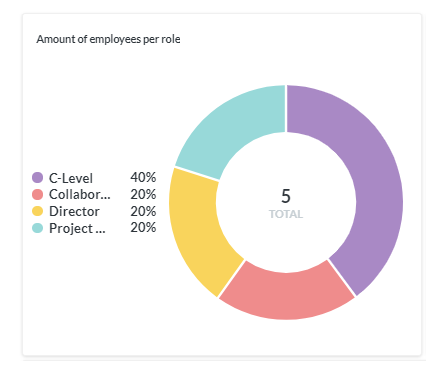
- Amount of employees per role: It shows the number of active users per role and the percentage they represent.
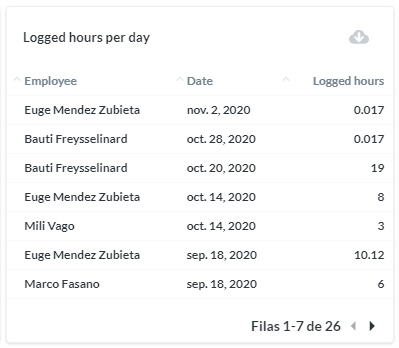
- Logger hours per day: Displays the sum of hours logged per day per user.
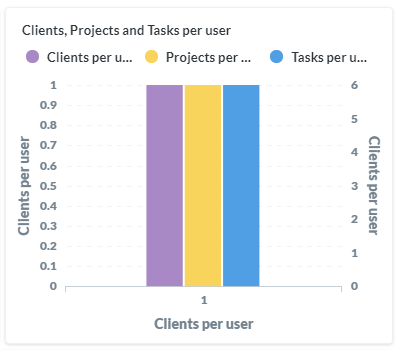
- Clients, Projects and Tasks per user: It shows the nubmer of clients, projects and tasks over the number of active users.
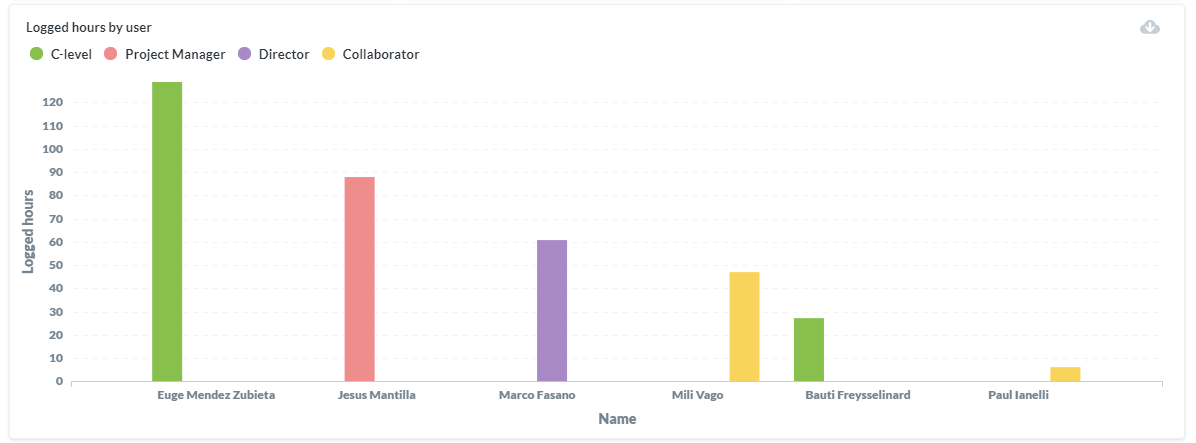
- Logged hours by user: Shows the sum of logged hours per user. Includes users who were deleted.
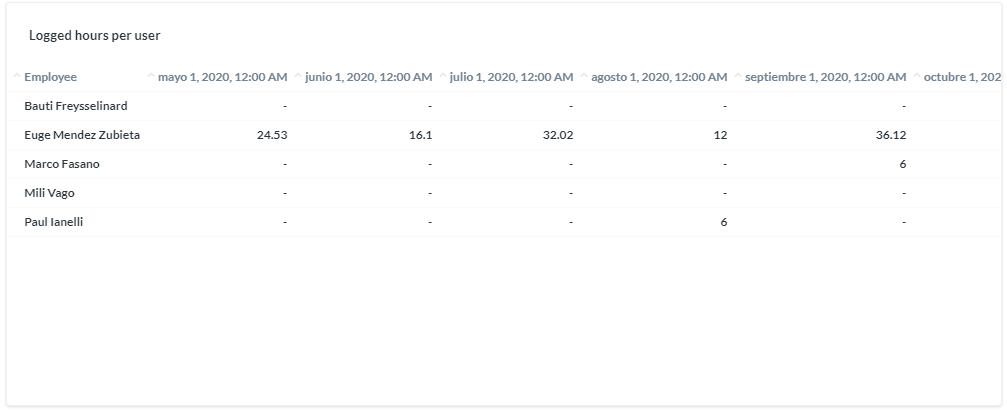
- Logged hours per user: Similar to the previous graph, but segmented month by month. Includes users who were deleted.
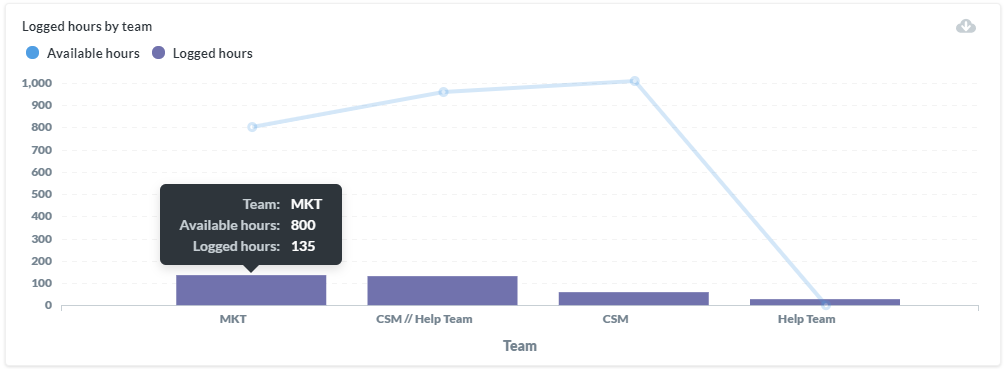
- Logged hours by Team: Shows a comparison between hours logged by team and available hours. Team availability is calculated by adding each member's monthly hours and subtracting the hours logged in that period.
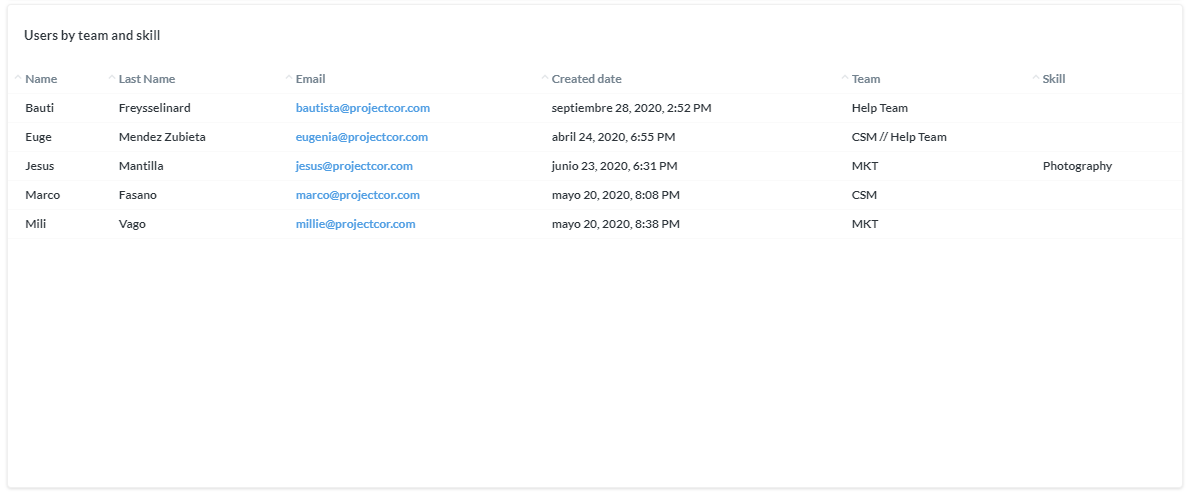
- Users by team and skill: Shows the list of active users with details of the teams they belong to and their skills (user labels).
The information shown on each of the panels can be downloaded in .csv, .xlsx or .json format by clicking on the download icon at the top right of each chart.